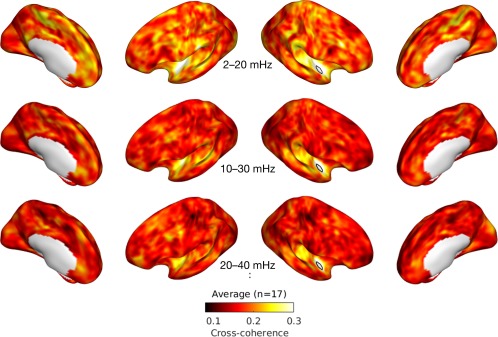
Figure 5.

First three averaged cross‐coherence maps. Cross‐coherence between the right planum polare (PP; marked by a white patch) and the rest of the cortex is averaged across all individuals (n = 17) for the first 3 frequency bins: 2–20 mHz (top), 10–30 mHz (middle), and 20–40 mHz (bottom). [Color figure can be viewed at http://wileyonlinelibrary.com]
