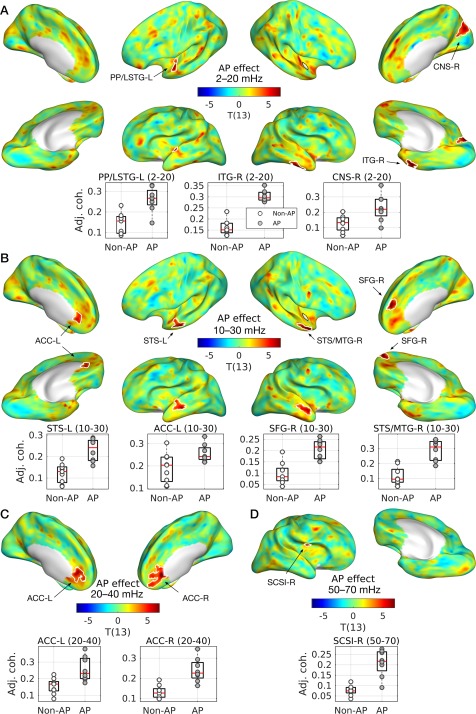
Figure 6.

Group differences between musicians with and without AP in cross‐coherence. T‐statistic maps are projected onto semi‐inflated cortical surfaces for the frequency bin of (A) 2–20 mHz, (B) 10–30 mHz, (C) 20–40 mHz, and (D) 50–70 mHz. Significant clusters are indicated by white contours. Below the T‐maps, boxplots with regression lines are given for the peak of each cluster. An open circle represents a musician without AP and a gray circle represents a musician with AP. Abbreviations: ACC‐L/R, left/right anterior cingulate cortex; CNS‐R, right cuneus; ITG‐R, right inferior temporal gyrus; LSTG‐L, lateral aspect of the left superior temporal gyrus; MTG‐R, right middle temporal gyrus; SFG‐R, right superior frontal gyrus; SCSI‐R, superior segment of the circular sulcus of the right insula; STS‐L, left superior temporal sulcus. [Color figure can be viewed at http://wileyonlinelibrary.com]
