
Figure 3.
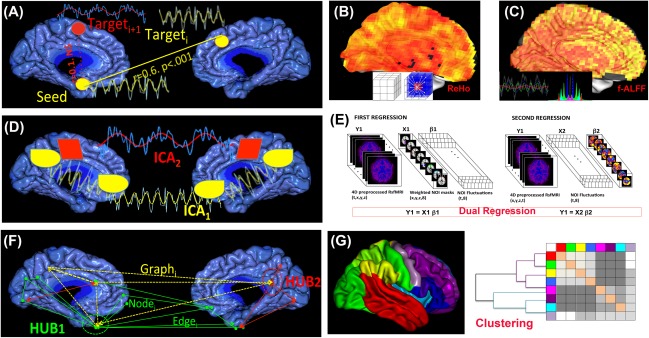
Schematic representation of analysis approaches that are used in pharma‐RSfMRI. (A) Seed‐based connectivity analysis; (B) REHO; (C) (f)ALFF; (D) ICA; (E) dual regression analysis; (F) Graph theory and (G) Hierarchical clustering.
Official websites use .gov
A
.gov website belongs to an official
government organization in the United States.
Secure .gov websites use HTTPS
A lock (
) or https:// means you've safely
connected to the .gov website. Share sensitive
information only on official, secure websites.
Schematic representation of analysis approaches that are used in pharma‐RSfMRI. (A) Seed‐based connectivity analysis; (B) REHO; (C) (f)ALFF; (D) ICA; (E) dual regression analysis; (F) Graph theory and (G) Hierarchical clustering.