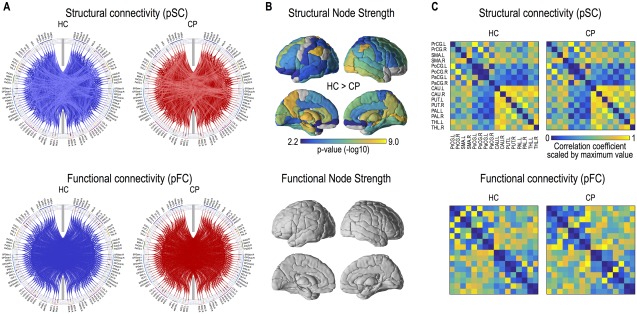
Figure 3.

Structural and functional networks in cerebral palsy (CP) and healthy controls (HC). Group‐average structural and functional networks are presented in blue lines for HC and in red lines for patients with CP (A). Structural connectivity was evaluated using probabilistic tractography (pSC) and functional connectivity was derived using partial correlation analysis (pFC). Brain regions having significantly reduced node strength of the structural network in CP are displayed (FDR < 0.01) (B). Group adjacency matrices (connectivity matrices) of structural and functional motor networks are presented (C). [Color figure can be viewed at http://wileyonlinelibrary.com]
