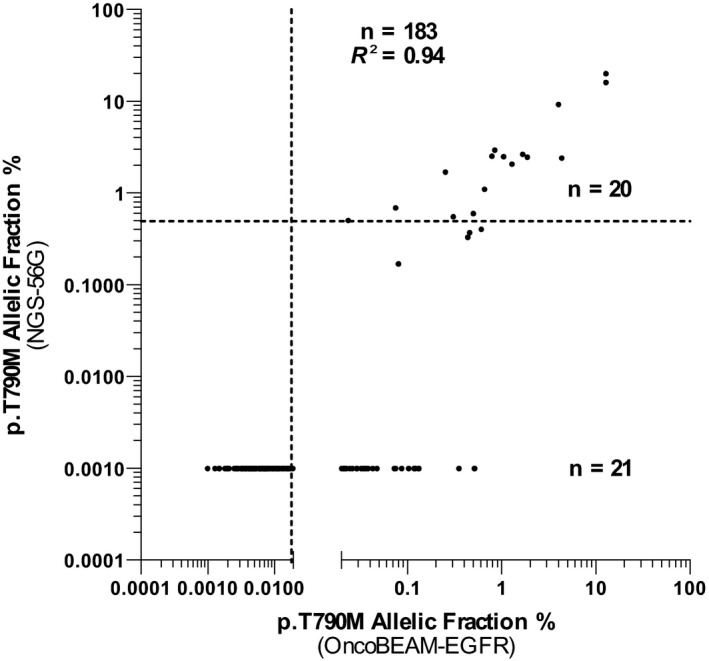
Figure 2.

Correlation of p.T790M allelic frequency between the OncoBEAM™‐epidermal growth factor receptor (EGFR) assay and the NGS‐56G assay. The correlation is good with an R2 at 0.94. The dotted lines represent the threshold of positivity: 0.5% for NGS assay (horizontal) and 0.02% for OncoBEAM™‐EGFR assay (vertical). 20 concordant cases and 21 discordant cases were observed
