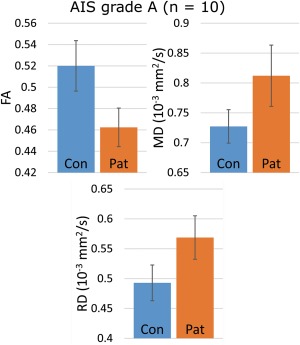
Figure 4.

The differences in absolute DTI values for the full injury group, taken from the statistically significant clusters for each significant DTI metric (P ≤ 0.01; FA, MD, and RD). The values represent mean values of the significant voxels, with error bars showing the ± SD for the volume mean. Note the apparent increase in difference compared to the whole‐group comparison. [Color figure can be viewed at http://wileyonlinelibrary.com]
