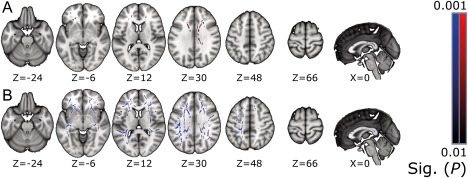
Figure 5.

Partial correlations maps (P ≤ 0.01) for TSI obtained from TBSS analysis. FA correlated positively with TSI (above, A), and MD correlated negatively (below, B). The results are overlaid on the MNI152 standard‐space template, with corresponding MNI coordinates below the slices. Neurological convention, left = left. [Color figure can be viewed at http://wileyonlinelibrary.com]
