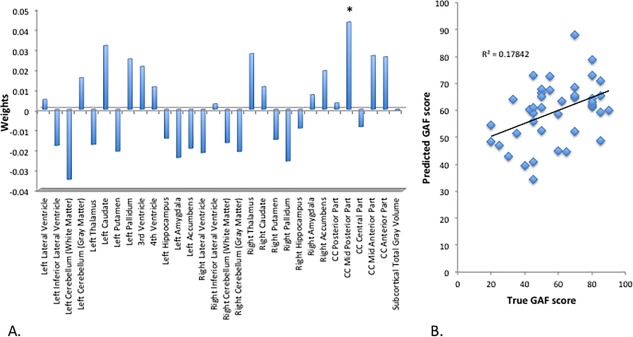
Figure 3.

SVR subcortical volumes predicting GAF‐score at 6‐year follow‐up. (A) Weight‐vector bar chart. (B) Scatter plot with linear trendline. CC = corpus callosum; SVR = support vector regression; GAF = global assessment of functioning. * = P < 0.05. [Color figure can be viewed at http://wileyonlinelibrary.com]
