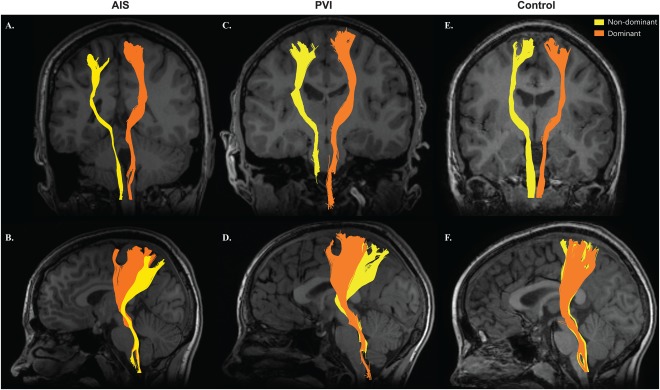
Figure 3.

DCML tracts. DCML sensory tracts of an AIS (A, B), PVI (C, D), and healthy control (E, F) participant. Non‐dominant tracts (yellow) were displaced laterally and posteriorly relative to the dominant tracts (orange) in the AIS (B) and PVI (D) participants. Each participant was within the normal range (two standard deviations from the mean) of fiber count in their respective group. [Color figure can be viewed at http://wileyonlinelibrary.com]
