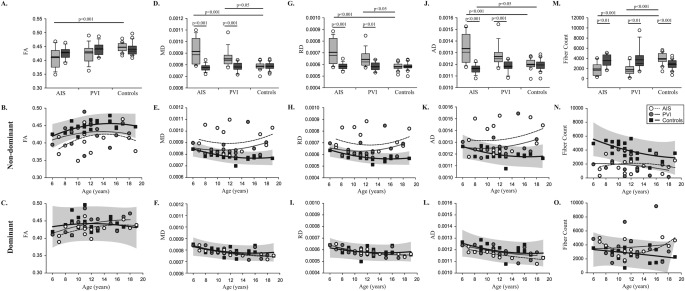
Figure 4.

Diffusion parameters of sensory tracts in cases and controls. Fractional anisotropy (FA) (A–C), mean diffusivity (MD) (D–F), radial (RD) (G–I), and axial (AD) diffusivity (J–L), and fiber count (M–O) are shown. Boxplots of diffusion parameters (top row) of non‐dominant (light gray bars) and dominant (dark gray bars) hemispheres are shown for each of the three groups. Scatter plots for the non‐dominant (middle row) and dominant (bottom row) hemisphere diffusion measures show the stroke cases and controls with 95% prediction intervals of control performance defining normal boundaries (light gray box).
