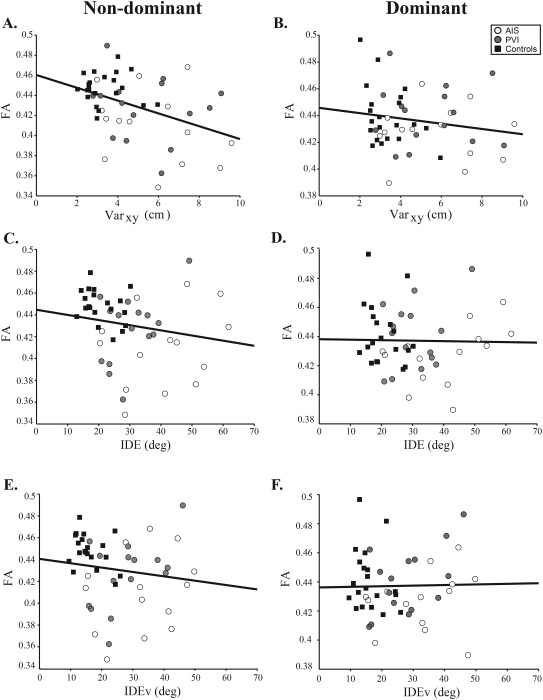
Figure 5.

FA versus robotic proprioception. Scatter plots for the non‐dominant and dominant hemisphere diffusion measures show the stroke cases and controls with fitted regression line. Varxy (A, B) was moderately correlated with non‐dominant hemisphere FA (R = −0.41, R 2 = 0.17, 95% CIFA: −0.65, −0.19, P < 0.005) but not FA in the dominant hemisphere (R = −0.17, R 2 = 0.029, 95% CIFA: −0.47, 0.22, P = 0.2). Kinesthetic IDE (C, D) did not correlate with non‐dominant FA (R = −0.13, R 2 = 0.017, 95% CIFA: −0.45, 0.24, P = 0.4) nor in the dominant hemisphere (R = 0.0074, R 2 = 5.5 × 10⁻⁵, 95% CIFA: −0.19, 0.41, P = 0.6). IDEv (E, F) did not correlate with non‐dominant FA (R = −0.099, R 2 = 9.8 × 10⁻³, 95% CIFA: −0.48, 0.25, P = 0.5) nor dominant hemisphere FA (R = 0.12, R 2 = 0.014, 95% CIFA: −0.14, 0.37, P = 0.4).
