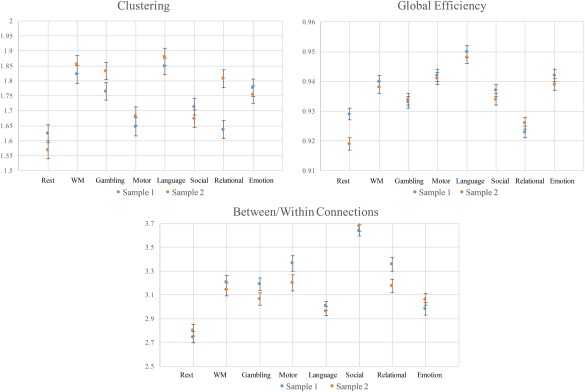
Figure 4.

The estimated marginal means (with error bars) for each whole‐brain network metric across the two split‐half samples. Metric values are plotted along the horizontal axis and task labels are plotted along the horizontal axis. Means for sample 1 are plotted in blue and means for sample 2 are plotted in orange. The results reveal that clustering, global efficiency and ratio of between‐ to within‐module connections were sufficiently reliable across split‐half samples. [Color figure can be viewed at http://wileyonlinelibrary.com]
