
Figure 5.
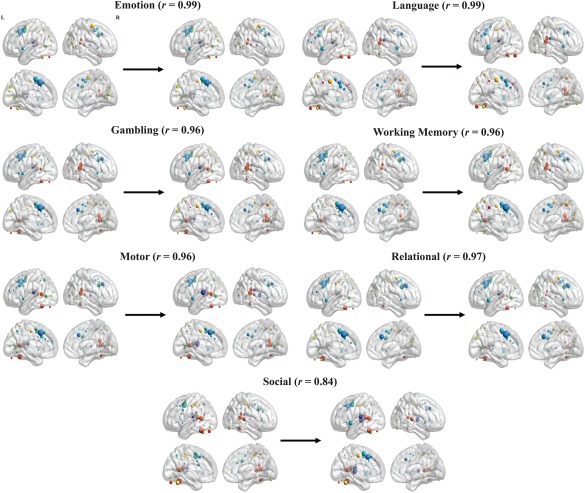
Comparison of node hubness values, with associated correlation values, before and after the regression of the convolved task block regressors. Node hubness was visualized in the same manner as Figure 2. Arrows and the values above them represent the correlation in hubness values across ROIs between the original (left) and regressed (right). The results demonstrate that the regression of task events had minimal effects on the hubness estimates. [Color figure can be viewed at http://wileyonlinelibrary.com]