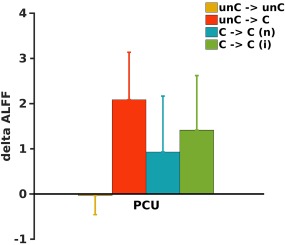
Figure 4.

Bar and error bar plots of changes in ALFF values in the PCU ROI as shown in Fig. 1A in four subgroups of patients. unC–>unC, two patients who were in unconsciousness state at Scan 1 and stayed in unconsciousness state at Scan 2; unC–>C, four patients who recovered consciousness at Scan 2 from unconsciousness state at Scan 1; C–>C (n), nine patients who were already conscious at Scan 1 with nonimproved GCS or CRS‐R; and C–>C (i), eight patients who were already conscious at Scan 1 with improved GCS or CRS‐R. [Color figure can be viewed at http://wileyonlinelibrary.com]
