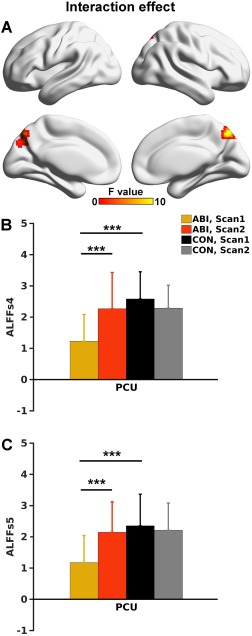
Figure 5.

A. Group by scan interaction effect of ALFFs4 (P < .05 corrected) mapped onto the cortical surfaces. B. Bar and error bar plots of ALFFs4 values in the PCU demonstrated in A. C. Bar and error bar plots of the ALFFs5 values in the PCU ROI as shown in B. ALFFs4, ALFF calculated in the slow‐4 frequency band (0.027–0.073 Hz); ALFFs5, ALFF calculated in the slow‐5 frequency band (0.01–0.027 Hz). [Color figure can be viewed at http://wileyonlinelibrary.com]
