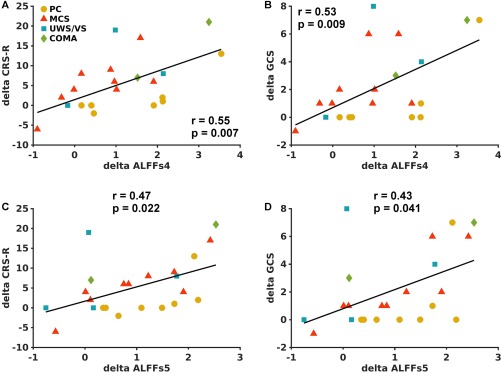
Figure 6.

Scatter plots between ALFFs4 changes in the PCU ROI as shown in Fig. 5A and the corresponding changes in CRS‐R (A) and GCS (B) scores in 23 ABI patients. Scatter plots between ALFFs5 changes in the PCU and the corresponding changes in CRS‐R (C) and GCS (D) scores. The ABI patients were labeled as shown in Figure 2. [Color figure can be viewed at http://wileyonlinelibrary.com]
