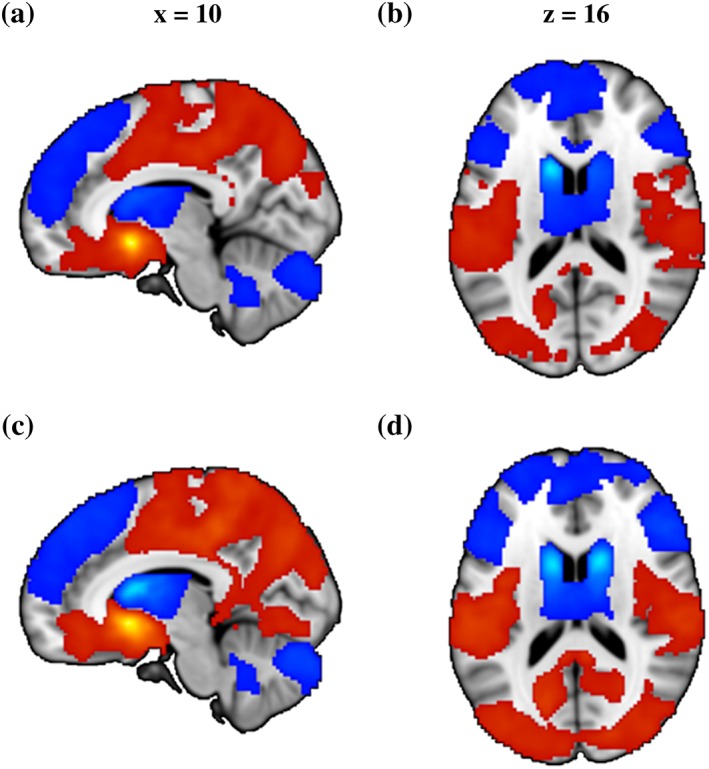
Figure 2.

Brain regions showing significant main effect of seed on functional connectivity. (a) and (b) Results from data‐driven seeds. (c) and (d) Results from validation seeds. Red color indicated stronger functional connectivity with VS than DS and blue color indicated stronger functional connectivity with DS than VS. All images were thresholded at p < .05, TFCE corrected
