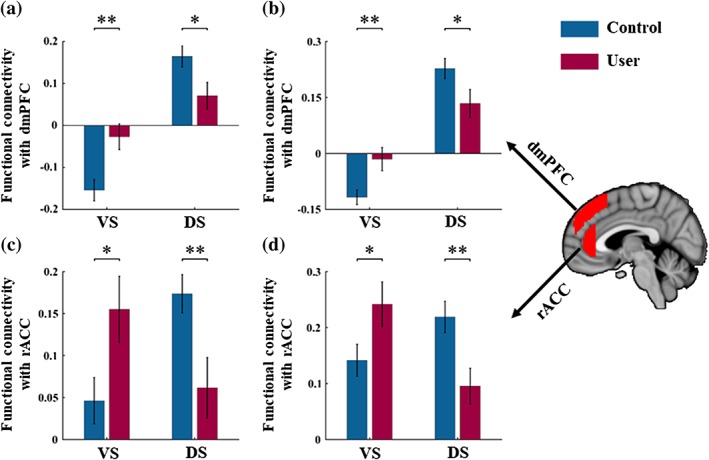
Figure 4.

Patterns of functional connectivity associated with a significant group (control vs user) by seed (VS vs. DS) interaction. (a) and (c) Results from data‐driven seeds and (b) and (d) Results from validation seeds. Error bars reflect the SEM. *p < .05; **p < .01; VS: Ventral striatum; DS: Dorsal striatum; dmPFC: Dorsomedial prefrontal cortex; rACC: Rostral anterior cingulate cortex
