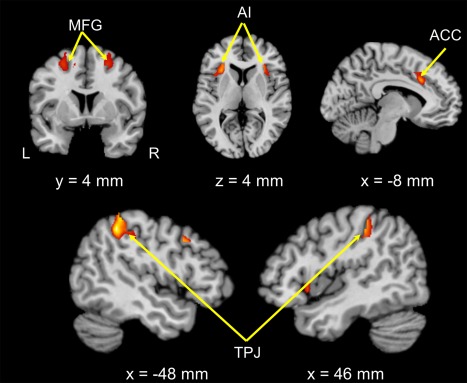
Figure 3.

Brain regions showing positive correlations between in‐group bias of costly punishment and neural response to in‐groups compared to out‐groups in the control condition. Images were thresholded at P < 0.05 corrected for multiple comparisons at the cluster level. L, left; R, right; MFG, middle frontal gyrus; AI, anterior insula; ACC, anterior cingulate cortex; TPJ, temporo‐parietal junction. [Color figure can be viewed at http://wileyonlinelibrary.com]
