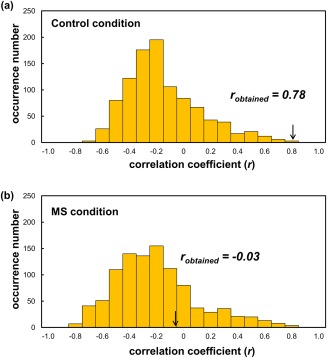
Figure 6.

Histograms of the permutation distribution of the correlation coefficient observed in pattern regression analysis. (a) Permutation distribution of the correlation coefficient in the control condition. (b) Permutation distribution of the correlation coefficient in the MS condition. The values obtained using the real data are indicated by the arrows. MS, mortality salience. [Color figure can be viewed at http://wileyonlinelibrary.com]
