
Figure 7.
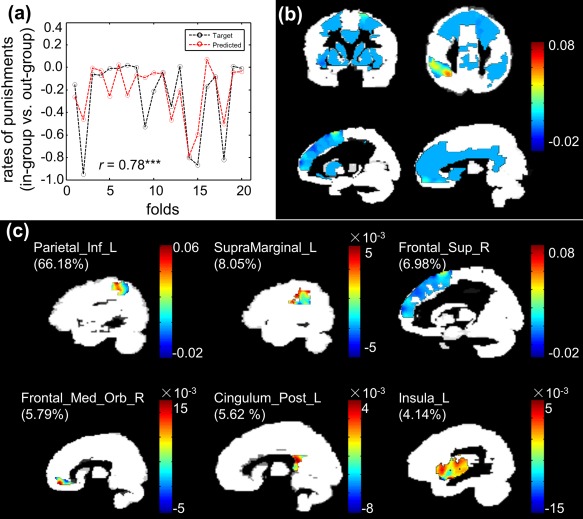
MKL findings revealed in the pattern regression analysis in the control condition. (a) Line plot showing consistency between actual and predicted in‐group bias of punishment. (b) Weight maps in the whole small volume. (c) Top six regions ranked by the MKL model used for predicting in‐group bias of costly punishment. [Color figure can be viewed at http://wileyonlinelibrary.com]