
Figure 6.
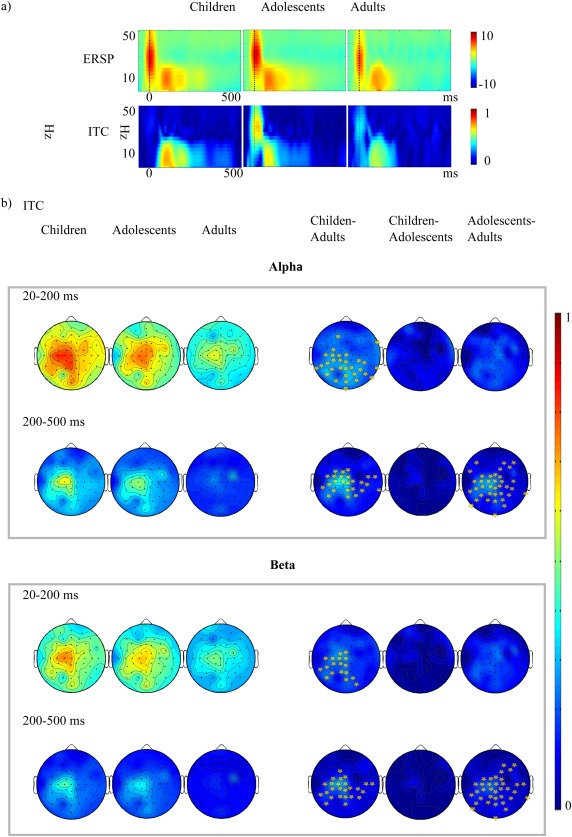
(a) The group‐wise ERSP (above) and ITC (below) values averaged from all channels. Zero corresponds to the TMS pulse. (b) ITC topography in alpha (8–15 Hz) and (beta 15–25) Hz range. In the right column the difference between the ITC distributions is shown (children minus adults, children minus adolescents and adolescents minus adults). The light dots represent the scalp positions where ITC is significantly increased in children and adolescents compared with adults.