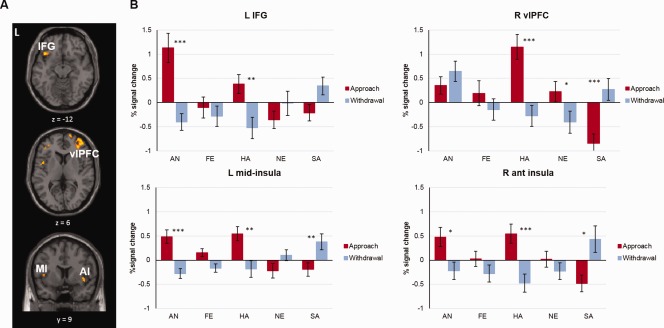
Figure 5.

(A) Clusters showing a direction × emotion interaction in the 5 × 2 ANOVA, including the left IFG, right ventrolateral prefrontal cortex (vlPFC), left mid‐insula (MI) and right anterior insula (AI; FDR‐corrected P < 0.05). (B) Graphs depicting the percent signal change per facial expression and direction in clusters showing a significant interaction (left IFG, right vlPFC left MI and right AI) (*P < 0.05, ** P < 0.01, *** P < 0.001). [Color figure can be viewed at http://wileyonlinelibrary.com]
