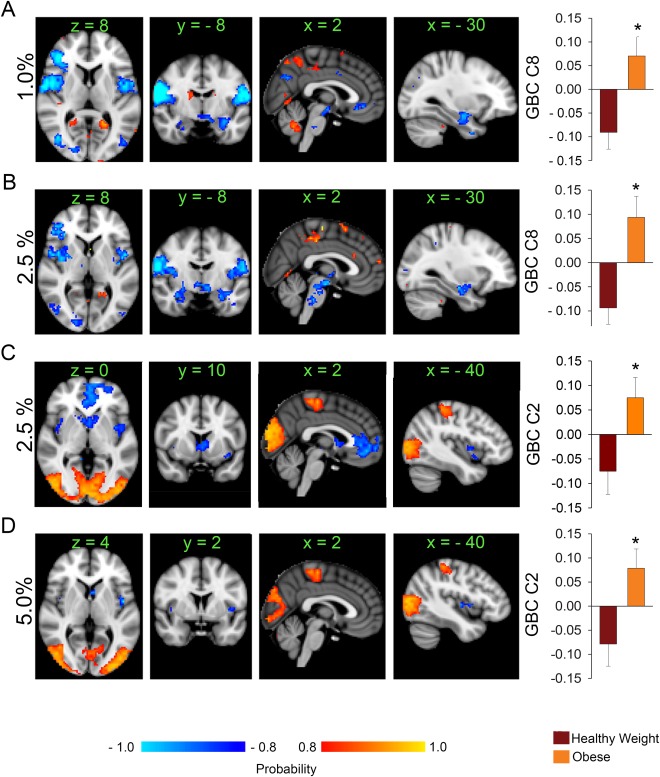
Figure 1.

Brain network reorganization in obesity (n = 15 per group) during milkshake receipt. (A) The histogram plot shows the average (± SEM) projections of each group's GBC maps unto the brain component shown above obtained after SVD is applied to the data at 1% wiring cost. The obese group has an average positive projection onto component 8. This indicates therefore that the obese group has decreased GBC compared to the healthy weight group within the feeding circuit and the DMN (areas shown in blue to light blue). Areas in red to yellow have increased GBC in the obese compared to the healthy weight group. (B) and (C) At a higher wiring cost (2.5%) the obese group exhibits loss of GBC within the feeding circuit also, and in areas monitoring internal milieu. (D) At 5% wiring cost, the obese group still shows decreased GBC within areas that respond to milkshake like the insula and caudate. * P < 0.05, unpaired t‐test, corrected for multiple comparisons; color bar, heat map of probability values; numbers above slices, MNI coordinates in mm; orientation follows radiological convention. Percentages indicate network‐wiring cost. Abbreviations: GBC, global brain connectivity; C8, component 8; C2, component 2. [Color figure can be viewed at http://wileyonlinelibrary.com]
