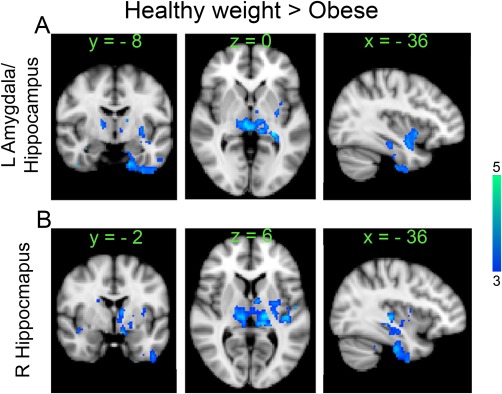
Figure 2.

Whole brain seed based connectivity differences between healthy weight and obese groups (Healthy weight > Obese, unpaired t‐test, n =15 per group, P < 0.05 corrected) using activity in left amygdala/hippocampus (A), and right hippocampus (B) as seeds during milkshake consumption. Color bar, heat map of T‐values. [Color figure can be viewed at http://wileyonlinelibrary.com]
