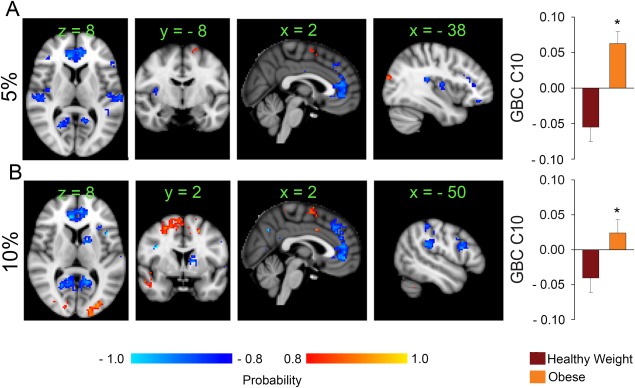
Figure 3.

Brain networks reorganization in obesity during resting state scans. (A) At rest, the obese group shows decreased GBC within bilateral insula, lateral and ventral medial prefrontal cortex and visual areas (blue to light blue areas); increased GBC is observed within the supplementary motor area compared to the healthy weight group. (B) At a higher wiring cost, similar changes occur with additional decreases in GBC in the caudate and increases in the visual areas. [Color figure can be viewed at http://wileyonlinelibrary.com]
