
Figure 5.
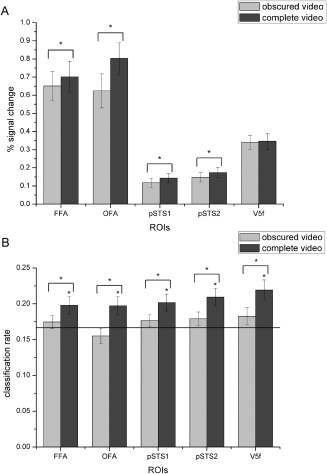
Average percent signal changes (A) and classification rates (B) for the obscured compared with the complete expressions in all ROIs. The black line indicates chance level, and all error bars indicate the SEM. * indicates statistical significance with one‐sample or paired t‐test, P < 0.05 (FDR corrected for number of ROIs). Activations for the obscured expressions were significantly lower than those for the complete expressions in all ROIs except V5f, and in all ROIs, the classification accuracies for the obscured expressions were significantly reduced.