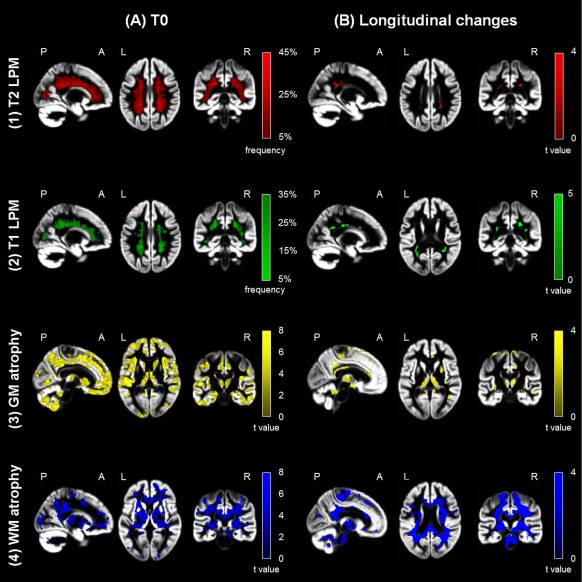
Figure 1.

Regional damage in multiple sclerosis (MS) patients versus healthy controls (HC) at baseline (T0) and follow‐up. (a) Representative images showing (1) T2 (red color‐coded) and (2) T1 (green color‐coded) lesion probability maps (LPMs) and statistical parametric mapping (SPM) analysis showing regions of (3) gray matter (GM) (yellow color‐coded) and (4) white matter (WM) (blue color‐coded) volume loss superimposed on the customized GM template in MS patients versus HC at T0 (P < 0.001 uncorrected; cluster extent = 10 voxels). The LPMs are thresholded to show voxels in which lesion frequency of 5% is present, up to a maximum lesion frequency of 45% for T2 LPM and of 35% for T1 LPM. (b) Representative images showing areas of increased frequency of (1) T2 (red color‐coded) and (2) T1 (green color‐coded) lesions in MS patients and regions of (3) GM (yellow color‐coded) and (4) WM (blue color‐coded) atrophy after 5 years superimposed on the customized GM template in MS patients versus HC (P < 0.001 uncorrected; cluster extent = 10 voxels). Images are in neurological convention. See text for further details. [Color figure can be viewed at http://wileyonlinelibrary.com]
