
Figure 2.
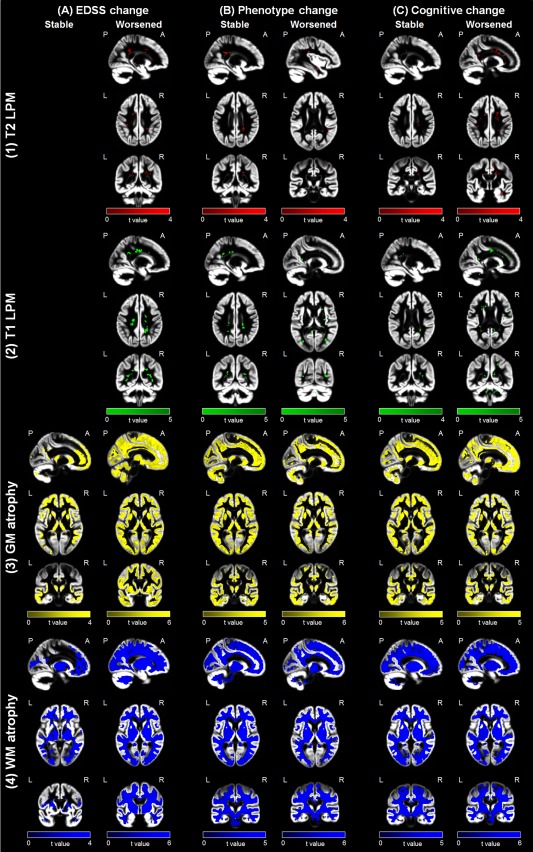
Evolution of regional damage in the main study subgroups. Representative images showing areas of increased frequency of (1) T2 (red color‐coded) and (2) T1 (green color‐coded) lesions and regions of (3) gray matter (GM) (yellow color‐coded) and (4) white matter (WM) (blue color‐coded) atrophy after 5 years superimposed on the customized GM template according to clinical (EDSS score and phenotype change) and cognitive evolution at follow‐up (P < 0.001 uncorrected; cluster extent = 10 voxels). Images are in neurological convention. See text for further details. [Color figure can be viewed at http://wileyonlinelibrary.com]