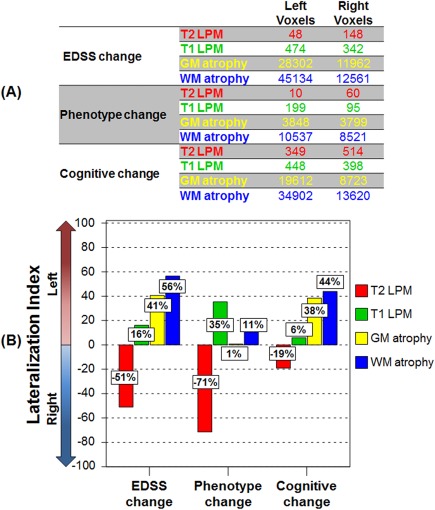
Figure 4.

Lateralization index in the main study subgroups. Graphical representation of (a) total number of voxels and (b) lateralization index of number of voxels in the left and right hemispheres showing increased frequency of T2‐hyperintense lesions (red color‐coded) and T1‐hypointense lesions (green color‐coded), and gray matter (GM) (yellow color‐coded) and white matter (WM) (blue color‐coded) atrophy after 5 years in worsened versus stable multiple sclerosis (MS) patients according to the different outcomes. The lateralization index of between‐group differences was calculated as (total number of significant left hemisphere voxels − total number of significant right hemisphere voxels)/(total number of significant brain voxels) × 100. See text for further details. [Color figure can be viewed at http://wileyonlinelibrary.com]
