
Figure 1.
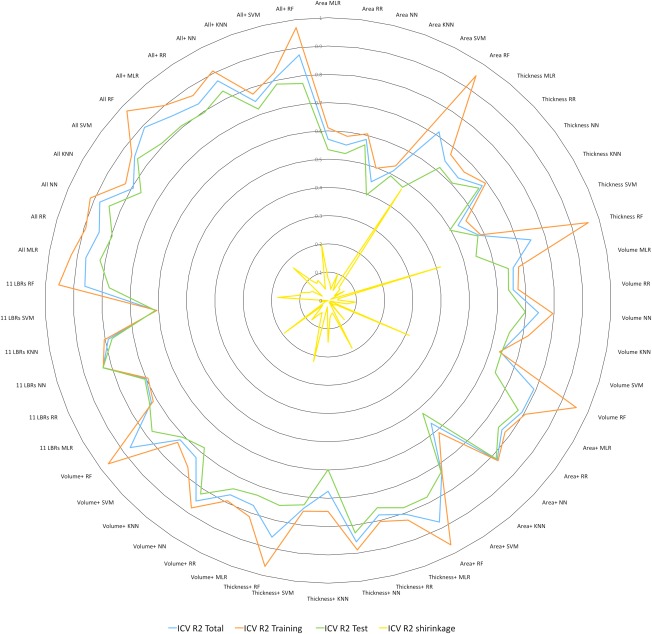
Radar plot showing all R 2 values for all anatomical feature sets and methods (blue: R 2 for the entire sample, green: R 2 for the training sample, red: R 2 for the test sample, black: R 2 shrinkage between training and test). NN: neural network, RR: ridge regression, RF: random forest, MLR: multiple linear regression, KNN: k‐nearest neighbor.