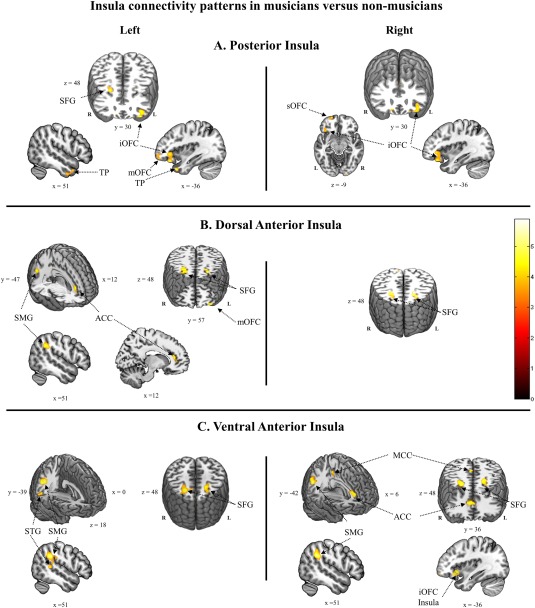
Figure 2.

T‐maps showing significantly increased functional connectivity in musicians relative to nonmusicians. (A) Posterior insula. (B) Dorsal anterior insula. (C) Ventral anterior insula. Left insula seed connectivity is displayed on the left and right connectivity on the right. Cluster‐extent significance thresholds were set at P < 0.05 FWER correction for multiple comparisons using Monte Carlo simulation as implemented in DPABI's instantiation [Song et al., 2011; Yan et al., 2016] of AlphaSim [Cox, 1996], following a stringent primary voxel‐level threshold of P < 0.001 and smoothness estimation based on the spatial correlation across voxels. SMG, supramarginal gyrus; STG, superior temporal gyrus; MCC, middle cingulate cortex; ACC, anterior cingulate cortex; TP, temporal pole; SFG, superior frontal gyrus; sOFC, superior orbitofrontal; mOFC, middle orbitofrontal cortex; iOFC, inferior orbitofrontal cortex. [Color figure can be viewed at http://wileyonlinelibrary.com]
