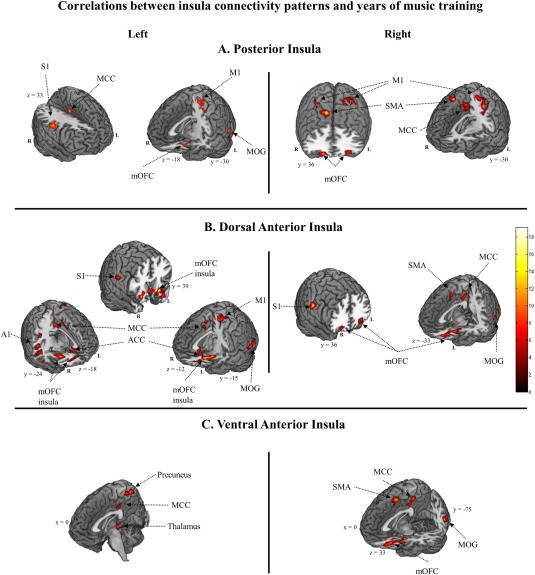
Figure 3.

Results from regression analyses testing for correlations between spontaneous BOLD fluctuation connectivity patterns of insula subdivisions and accumulated years of training in professional musicians. Results are thresholded at P < 0.05 FWER correction for multiple comparisons using cluster‐extent‐based Monte Carlo simulation as implemented in DPABI's instantiation [Song et al., 2011; Yan et al., 2016] of AlphaSim [Cox, 1996], following a stringent primary voxel‐level threshold of P < 0.001 and smoothness estimation based on the spatial correlation across voxels. S1, primary somatosensory cortex; M1, primary motor cortex; A1, primary auditory cortex; MOG, middle occipital gyrus; SMA, supplementary motor area; MCC, middle cingulate cortex; ACC, anterior cingulate cortex; mOFC, middle orbitofrontal cortex. [Color figure can be viewed at http://wileyonlinelibrary.com]
