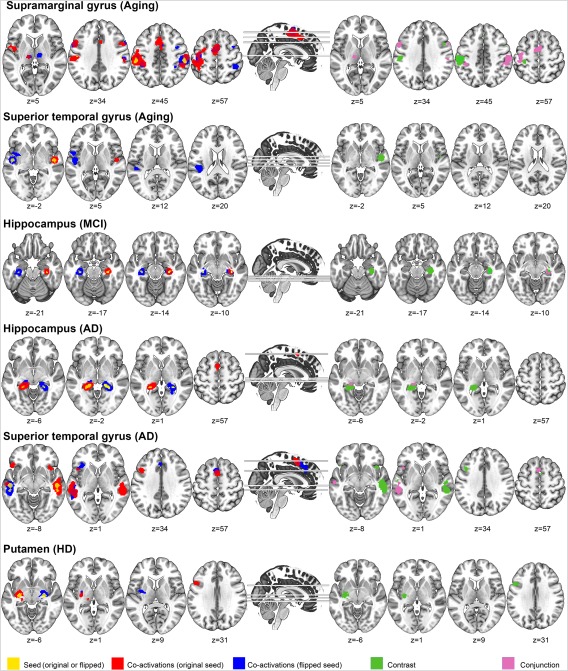
Figure 4.

MACM results for regions showing GM asymmetries. Yellow: seed regions used for each analysis. Red: co‐activation patterns with the original seed. Blue: co‐activation patterns with the flipped, contralateral seed. Green: Contrast/difference between original and flipped MACM results. Purple: Conjunction (minimum statistic) analysis between original and flipped MACM results. Coordinates [x/y/z] are provided in MNI space. L indicates left and R indicates right. [Color figure can be viewed at http://wileyonlinelibrary.com]
