
Figure 1.
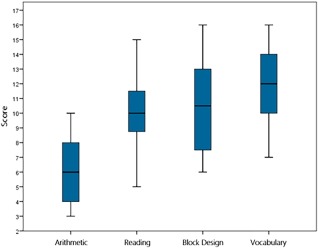
Box plots displaying the performance of the standardized assessment. Note: The scores above are standardized scores. The scores on the arithmetic test are standardized as M = 5, SD = 2, with a maximum of 10. The scores on the other tests are standardized as M = 10, SD = 3, with a maximum of 20. [Color figure can be viewed at http://wileyonlinelibrary.com]