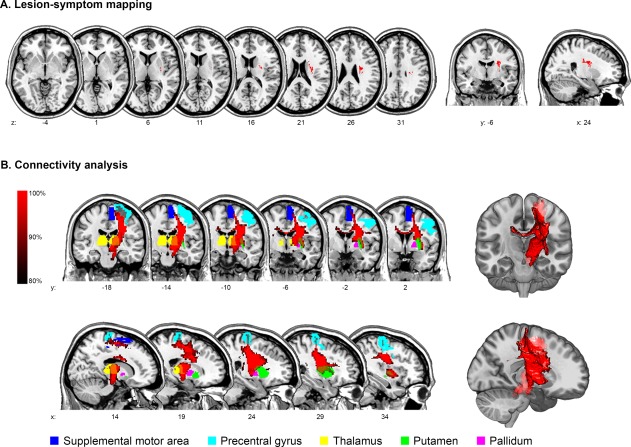
Figure 2.

Imaging analysis after ≥7 days. (A) Voxel‐based lesion‐symptom mapping of impaired oral intake after ≥7 days. (B) Connectivity analysis of the statistical map. For illustration purposes, a mean path with a minimum frequency of 80% is displayed and significantly connected regions are overlaid. [Color figure can be viewed at http://wileyonlinelibrary.com]
