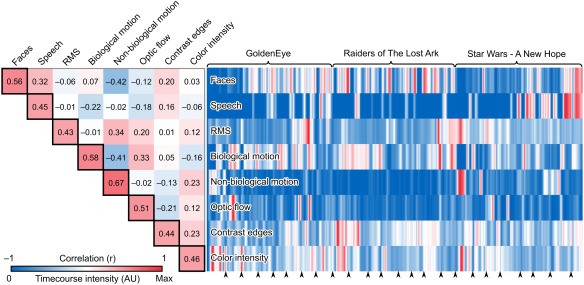
Figure 2.

Correlation matrix and timecourses of the stimulus models. The pairwise correlation coefficients (r) of the stimulus features are presented in the upper triangle entries. Color coding indicates the correlation coefficient. The diagonal entries with black borders indicate how much of each stimulus feature model is explained by all other stimulus features together (r) after linear fitting. Normalized timecourses of the stimulus models convolved with a canonical HRF are shown next to the correlation matrix. Color coding indicates the amplitude of the stimulus features at each time point. The arrow heads indicate the starting points of the movie clips.
