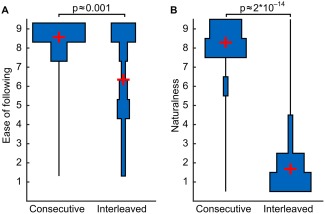
Figure 3.

Distributions of self‐reported ease of following events from one clip to another (A) and naturalness of movie scene transitions (B) in the Consecutive and Interleaved conditions. Distributions are depicted as symmetrical binned histogram violin plots to show the full distribution of ratings where zero is at the middle of the bars parallel to the y‐axis. Empty bins are indicated by the line in the middle of the histogram (zero). P‐values are from paired t‐tests.
