Figure 4.

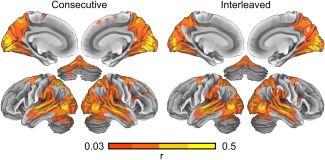
Brain areas showing significant inter‐subject correlation during movie viewing in the Consecutive and Interleaved conditions. The data are thresholded at P < 0.01 (uncorrected P‐value in the ISC distribution calculated across conditions).

Brain areas showing significant inter‐subject correlation during movie viewing in the Consecutive and Interleaved conditions. The data are thresholded at P < 0.01 (uncorrected P‐value in the ISC distribution calculated across conditions).