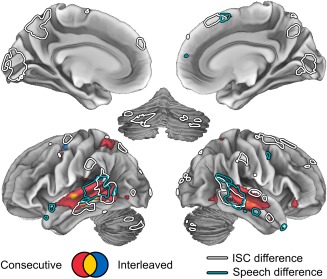
Figure 8.

Areas activated while following continuous action in Consecutive (red) and Interleaved (blue) conditions. Colored areas indicate the conjunction of the responses to (positive) cut‐points and (negative) action discontinuities. Overlapping areas in both conditions are indicated by yellow. Both cut‐points and action discontinuities have been thresholded at q < 0.05 (FDR corrected). The area of conjunction corresponds to the areas where both effects overlap. Outlines indicate areas showing differences in ISC (white) and speech sensitivity (turquoise) across conditions (see Figures 5 and 7, respectively).
