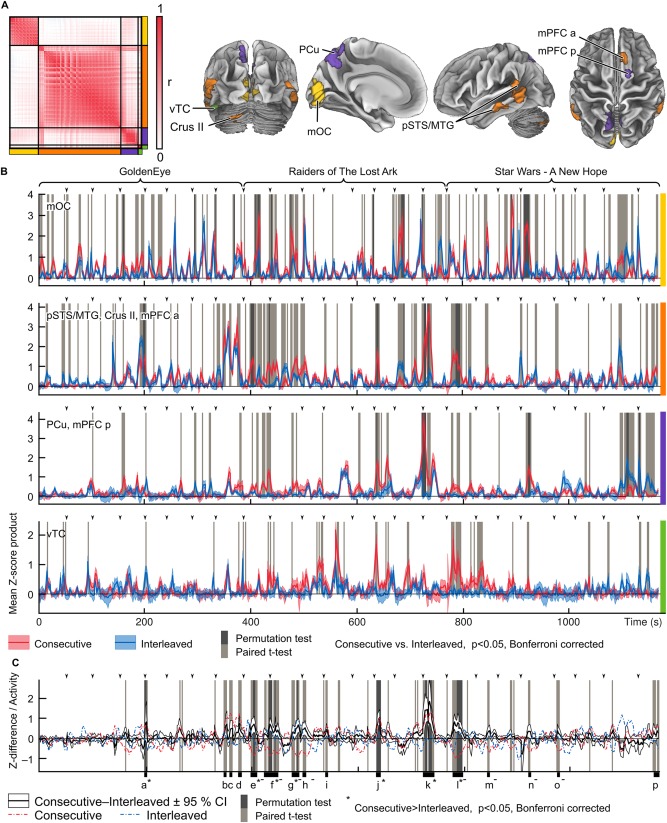
Figure 9.

Timecourses of products of Z‐scores over subject pairs (instantaneous similarity) contributing to the mean ISCs and ISC group differences. A: (Left) Correlation matrix and clustering of the voxels showing significantly higher ISC in Consecutive versus Interleaved condition. The different clusters are separated by black lines and indicated by the colors on the right and bottom of the matrix. (Right) Locations of the clusters are indicated by colors on the brain visualizations on the right. Abbreviations as in Figure 5, in addition: vTC, ventral temporal cortex, dmPFC a/p, dorsomedial prefrontal cortex, anterior/posterior. B: Mean timecourses of Z‐score products across subject pairs for the clusters. Consecutive condition is show in red and Interleaved condition in blue. Timepoints where the mean timecourse of each cluster showed significant (P < 0.05, Bonferroni corrected; t‐test light gray, permutation test dark gray) between‐condition difference are indicated with gray vertical bars. Arrow heads indicate the onset times of each short movie segment and the full duration of each movie excerpt is indicated by the braces on top of the plots. The clusters are indicated by the colored bars on the right side of the plots. C: Mean difference of Z‐score products between conditions across all voxels in the orange, purple and green clusters. Significant differences (P < 0.05, Bonferroni corrected) are indicated by gray bars (t‐test result with lighter and permutation test results in darker gray). Red and blue dashed lines indicate the mean standardized activity over subjects and voxels in the orange, purple and green clusters. Time windows marked with a–p indicate instances where the mean timecourses showed most consistent differences across all voxels in the three clusters. Windows shorter than 3 TRs have been omitted and windows that are separated by less than 3 TRs have been collapsed into one longer window. The error bars on all plots indicate 95% confidence intervals. Time windows containing timepoints that were significant in the permutation test are indicated by the asterisks (*). Timepoints of significant difference across conditions caused by deactivations in the Consecutive condition are marked by minus (−) signs.
