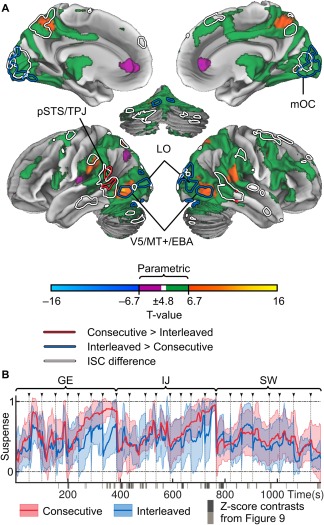
Figure 10.

Brain regions responding to experienced suspense. A: Main effects of suspense in a GLM analysis across both conditions. Due to the autocorrelation structure of the slow signals in the model, the results are thresholded (P < 0.05, FDR corrected) based on both standard parametric t‐test and null GLMs where the models were circularly shifted. Parametric effects are shown in green (positive) and purple (negative) tones. Differences across conditions in the GLM results are shown in red (Consecutive > Interleaved) and blue (Interleaved > Consecutive) outlines. White outlines indicate areas showing ISC differences in Figure 5. B: Mean ratings (±95% CI) of suspense in the Consecutive (red) and reordered Interleaved (blue) condition. Movie clip onsets are indicated by arrows and gray dashed lines. Gray bars at the bottom of the plot show the differences across conditions in Figure 9C. Abbreviations as in Figures 5–7.
