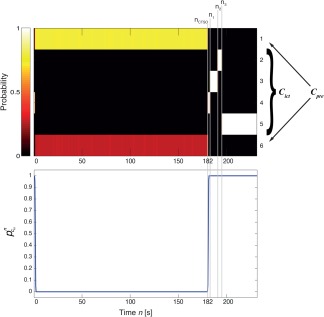
Figure 10.

Automatic dichotomization of the centroid set and detection of the ictal state transition times. Top panel: Color‐coded, example posterior membership profile during the preictal and ictal periods (for K = 6 centroids). x‐axis gives the time window n in seconds, y‐axis the centroid index. The procedure described in the main text produces an ictal centroid subset , whose posterior membership probability increases sharply at , that is, 2 s after the clinical seizure onset at (bottom panel, the large value of at is due to the prior probability of the Markov chain for z 0). Within the ictal period individual centroids each become activated with increased membership probability during four distinct states with transition times at . Likewise C ict, the transition times and n 3 are also detected in an automated manner by procedures described in the main text. [Color figure can be viewed at http://wileyonlinelibrary.com]
