
Figure 3.
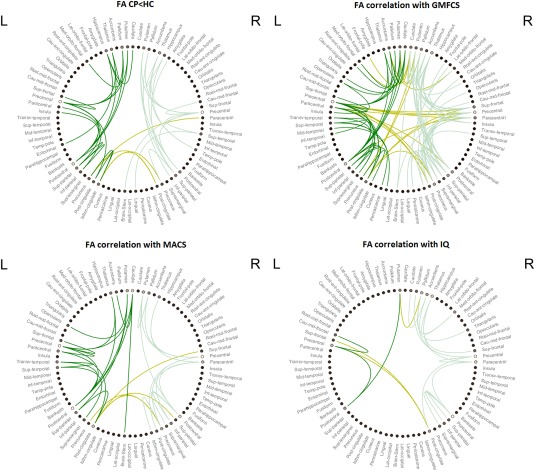
Circular graph of the results of the network‐based statistic analysis (NBS). Lines indicate significant connections for every kind of analysis. Edge colors separate intrahemispheric connections (dark green for the left hemisphere; soft green for the right hemisphere) and interhemispheric connections (green‐yellow). The color of the circle nodes indicates the number of connections of this node that are included in the component: the brighter means more connections. CP: Cerebral palsy; FA: Fractional anisotropy; GMFCS: Gross Motor Function Classification System; HC: Healthy controls; IQ: Intelligence quotient; L: Left; MACS: Manual Ability Classification System; R: Right. Schemaball was used to create this figure [Komarov, 2013]. [Color figure can be viewed at http://wileyonlinelibrary.com]