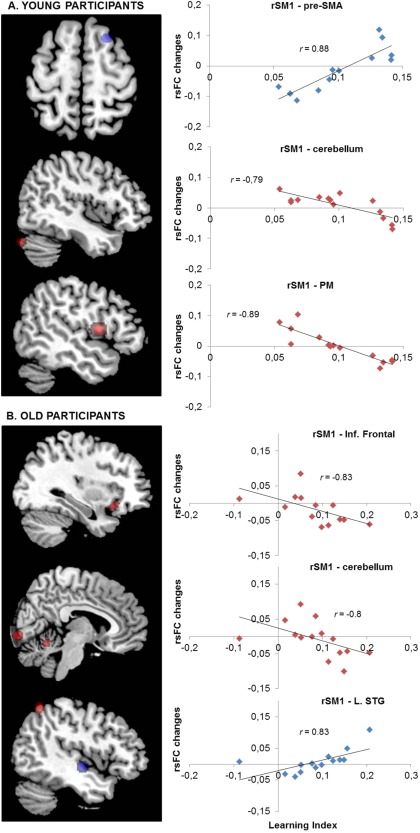
Figure 3.

Post‐training changes in rsFC (Rest 2–Rest 1) in relation to motor learning index in young [A] (top panels) and old [B] (lower panels) participants. Color‐coded statistical maps (P corr < 0.05) show positive (blue) and negative (red) correlations between the rsFC changes and the motor learning index. The right panels represent the linear trend between individual rsFC changes and the associated learning index in the significant regions (see Table I for MNI coordinates). The value r represents the Pearson's correlation coefficient. rSM1, right primary sensorimotor cortex; SMA, supplementary motor area; PM, premotor area; Inf., Inferior; L., left; STG, superior temporal gyrus. (See Supporting Information data for all correlations: Figs. S1 and S2). [Color figure can be viewed at http://wileyonlinelibrary.com]
