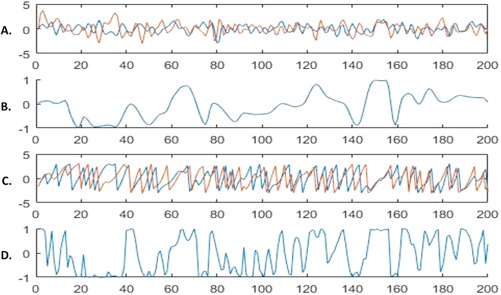
Figure 2.

The DCS and wideband signals. Panel A shows two random wideband signals. Panel B shows the DCS for the two signals. Panel C shows the phase vectors for the two signals. Panel D shows the iFC for the two signals. Visual inspection of Panel C reveals the characteristics of the DCS that make it suitable for wideband signals. The DCS indicates no synchronization from time points 1–15, where the phases are clearly not locked into the same frequency, but the iFC indicates rapidly fluctuating synchrony. Time points 20–30 show strongly antisynchronized signals (i.e., phases are 180° apart), and both the iFC and DCS are in agreement; however, at time point 40, the iFC indicates strong synchrony when in fact the phases are not locked onto the same frequency for the two signals; the DCS, in contrast, indicates no synchrony between the signals. Finally, time points 145–155 show that the phase vectors have locked onto the same frequency, and the signals are strongly synchronized; the iFC and DCS are in agreement. The DCS and iFC, however, fall out of agreement shortly after when the frequencies of the two signals again change at different rates; the iFC indicates rapidly fluctuating synchrony, whereas the DCS indicates no synchrony (see also time points 190–200). [Color figure can be viewed at http://wileyonlinelibrary.com]
