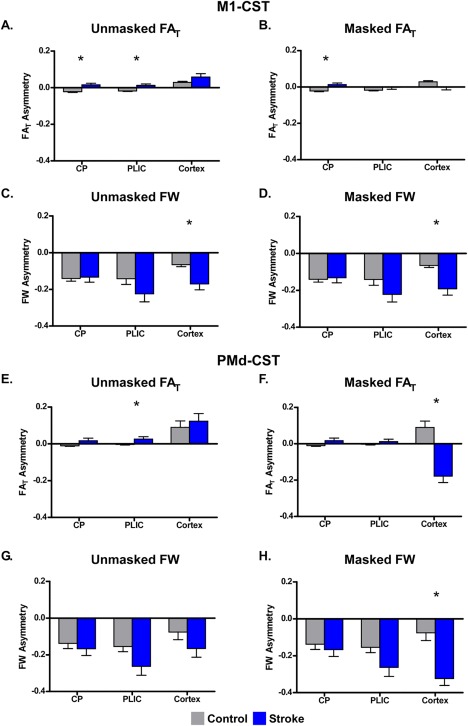
Figure 2.

Between‐group differences in FAT and FW asymmetry within the CP, PLIC, and cortex. Mean FAT and FW asymmetry is shown for the unmasked (left column) and masked (right column) analyses for the CP, PLIC, and cortex ROIs within M1‐CST and PMd‐CST for the control (gray) and stroke (blue) groups. Each bar represents the group mean within each ROI, and the error bars represent ±SEM. A positive asymmetry score indicates lower FAT/FW in the impaired hemisphere compared to the unimpaired hemisphere. A negative asymmetry indicates higher FAT/FW in the impaired hemisphere compared to the unimpaired hemisphere. [Color figure can be viewed at http://wileyonlinelibrary.com]
