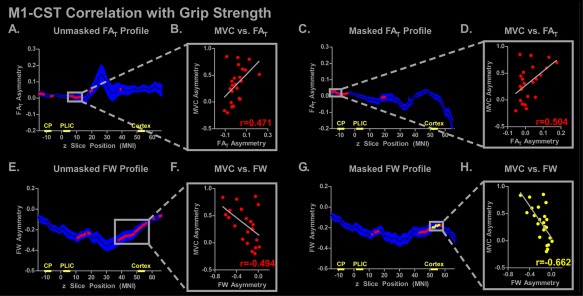
Figure 4.

M1‐CST slice‐by‐slice correlations of FAT and FW asymmetry with grip strength. The mean unmasked and masked FAT and FW asymmetry profiles are shown for the stroke subjects, in which the mean is represented with a black line and the blue shading representing ±SEM. Simple regression was performed at each axial slice, and significant correlations are shown with red (P < 0.05) or yellow (P < 0.05, FDR corrected) dots. The plot to the right of each profile demonstrates the FAT/FW asymmetry with grip strength asymmetry (MVC). The correlation coefficient for each simple regression is shown. The locations of the CP, PLIC, and cortex ROIs used in the ROI analysis are shown on the x‐axis. [Color figure can be viewed at http://wileyonlinelibrary.com]
