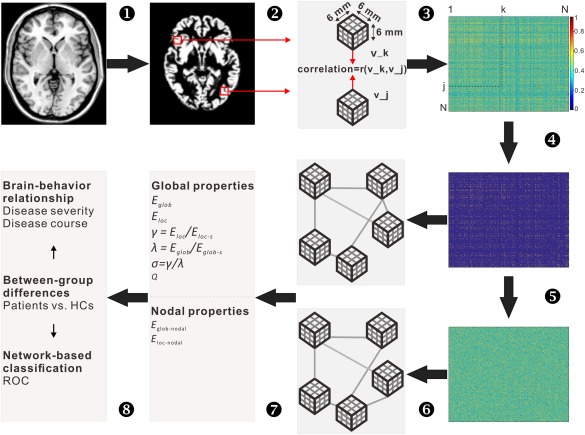
Figure 1.

Schematic pipeline to the extraction of single subject morphological networks. T1 images (1) were first segmented into gray matter maps (2), from which a series of cubes (3 × 3 × 3 voxels) were extracted. The similarity between any pair of cubes was then calculated according to the method proposed by Tijms et al. [2012], and therefore generating a similarity matrix for each participant (3). The similarity matrices subsequently underwent a thresholding procedure to exclude non‐significant connections (P > 0.05, Bonferroni corrected) (4). For each of the resultant weighted networks, 100 random networks were generated that preserved the same number of nodes and edges and the same degree distribution to the real brain networks (5). The real and random networks can be represented as graphs (6), whose topological organization was further analyzed at both global and nodal levels (7). Finally, between‐group differences in network measures, brain‐behavior relationship and network‐based classification were performed (8). Abbreviation: mm, millimeter; E glob, global efficiency; E loc, local efficiency; E glob‐s, global efficiency of random networks; E loc‐s, local efficiency of random networks; E glob‐nodal, nodal global efficiency; E loc‐nodal, nodal local efficiency; γ, gamma; λ, Lambda; σ, small world; Q, modularity; vs., versus; HCs, healthy controls; ROC, receiver operating characteristic curves. [Color figure can be viewed at http://wileyonlinelibrary.com]
