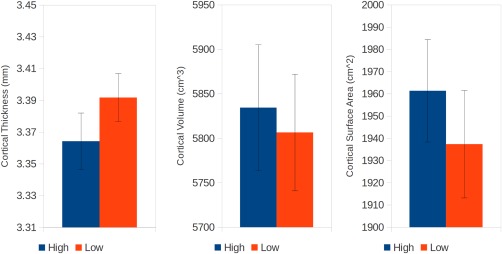
Figure 1.

Plots of average cortical thickness (left), cortical volume (middle), and cortical surface area (right) in the High (blue) versus Low (red) birth weight members of each twin pair (mean ± SEM). [Color figure can be viewed at http://wileyonlinelibrary.com]
